Summary: The Stanford Graduate School of Business 2024 Search Fund Study reports the outcomes and statistics for nearly 700 search funds formed in the U.S. and Canada. The latest search fund statistics show a record number of searchers from increasingly diverse backgrounds engaging in the model for the first time. Median returns remain consistent with previous years, with a few significant exits driving the overall average IRR higher in 2022–2023.
In 2026 the popularity of the search fund model of entrepreneurship through acquisition (ETA) continues to grow, it’s attracting a diverse new crop of operators, entrepreneurs, and investors.
It can be difficult to take the pulse of an industry that’s still evolving. But comparing the most up-to-date search fund statistics against historical data can offer insights into the magnitude and direction of changes in the way acquisition entrepreneurs are employing this model.
Fortunately, one of the country’s premier business schools keeps meticulous records, offering us statistics going back to the original search funds it helped to pioneer 40 years ago. I’ve plucked some key takeaways out of the most recent study that capture the current state of the search fund landscape.
About the Stanford GSB Search Fund Study
The term “search fund” originated at the Harvard Business School in 1984. Since then, its use has spread to all the major business schools (Wharton, Kellogg, IESE, etc), with The Stanford Graduate School of Business publishing the best known biennial study covering every known traditional search fund in the U.S. and Canada. The report is a treasure trove of information going back 40 years to the very first search funds.
The 2024 study (the latest release) contains statistics and outcomes for the 681 search funds formed in the U.S. and Canada since 1984, as of December 31, 2023.
A Note About Self-funded Search Statistics
The Stanford GSB 2024 Search Fund Study focuses on traditional (or core) search funds formed by first-time searchers. But it acknowledges that other forms of search funds exist, including self-funded searches and, to a lesser extent, independent sponsors.
Comprehensive data that includes results from self funded searchers and every individual searcher would be virtually impossible to collect, but some overall patterns exist.
Self-funded searchers who don’t have the benefit of institutional backing (no pre-committed capital) often use more debt in their capital structure, often taking out SBA loans that they must personally guarantee.
This limits the size of self-funded search deals. Most self-funded searchers target deals in the $1m–$10m enterprise value range, whereas traditional search funds may look at deals anywhere between $5m and $50m.
Self-funded searchers take on more personal risk but also retain more of the equity compared to entrepreneurs in traditional search fund deals. This means they can retain greater control over the business and enjoy extremely high upside when their deals go well. CapitalPad is an SMB investing platform that invests in search fund deals, allowing them to close deals above their own personal balance sheet.
International Search Fund Statistics
The Stanford GSB study covers search funds forms in the United States and Canada only. But it suggests a growing number of internationally based search funds and first-time searchers originating elsewhere globally.
International search fund statistics are beyond the scope of this piece, but interested readers can find more information in a sister study conducted by the IESE Business School: International Search Funds – 2024.
Key Findings: 2024 Search Fund Statistics
- Total search funds since 1984: 681
- Searches launched in 2023: 94 (record high)
- Acquisitions completed in 2023: 29
- Share of funds that acquired: 63%
- Average IRR across all funds: 35.1%
Below are highlights of the key search fund statistics found in the 2024 Search Fund Study. For further details, you can read the full study.
Number and Size of Search Fund Acquisitions
The number of new search funds being formed leveled off in 2021 and 2022 before setting a new record high of 94 searches launched in 2023. The study finds no single factor behind the uptick, but credits broader education about the model and an increase in available search fund investor capital with attracting more entrepreneurs to search funds.
The number of investors looking to allocate into the search asset class has ballooned. CapitalPad has become one of the most active investors in the search fund space, with a specific focus on search, independent sponsor, and self-funded search fund investing deals.
The ecosystem of debt financing sources has also expanded, as more and more lenders become comfortable with the search asset class.
The number of acquisitions declined to 29, down from a peak of 40 in 2021 but still above the long-term trendline.
Of those search funds that have concluded their search, 63% successfully acquired a company.
Search Fund Activity by Year

Image Source: Stanford Graduate School of Business 2024 Search Fund Study
Looking at the median statistics for recent search fund acquisitions reveals the evolution of the search marketplace.
The average search length returned to a more typical 20 months after shortening to 17 months in the 2020–2021 era. That reversion and the slight decrease in the median purchase price (from $16.5 million to $14.4 million) are likely due to the tighter monetary policy and higher interest rates since 2021.
In the 2022–2023 window studied in the 2024 report, the median searcher’s initial capital raise reached $500k for the first time. The median EBITDA multiple of search fund deals was 7.0x. The median company EBITDA at purchase was $2.2 million, and the media EBITDA margin of acquired companies was 27%. The median EBITDA growth rate at purchase was 25%.
Median Statistics for Recent Search Fund Acquisitions
- Median purchase price: $14.4M
- Median EBITDA multiple: 7.0×
- Median EBITDA at purchase: $2.2M
- Median EBITDA margin: 27%
- Median EBITDA growth rate: 25%

Image Source: Stanford Graduate School of Business 2024 Search Fund Study
Top Industries Targeted
- Healthcare: 25% of acquisitions
- Business services: 25%
- Software & technology: 22%
- Tech-enabled services: 16%
Search fund entrepreneurs choose their acquisition targets carefully, usually opting for industries that they have some experience in. Sectors ripe with high-revenue, consistently profitable companies that are relatively straightforward to operate make the best targets for acquisition entrepreneurs. Searchers prefer businesses with sufficient size and profit margins that are insulated from seasonality, cyclicality, customer concentration, and upstart competitors.
These factors characterize some industries better than others, including healthcare, business services, software and other technology, tech-enabled services, and manufacturing.
Since 2014, healthcare and business service companies have accounted for half of all search fund acquisitions. The leading industries targeted by search funds in the past decade are:
Industries of Acquired Companies (2014–2023)
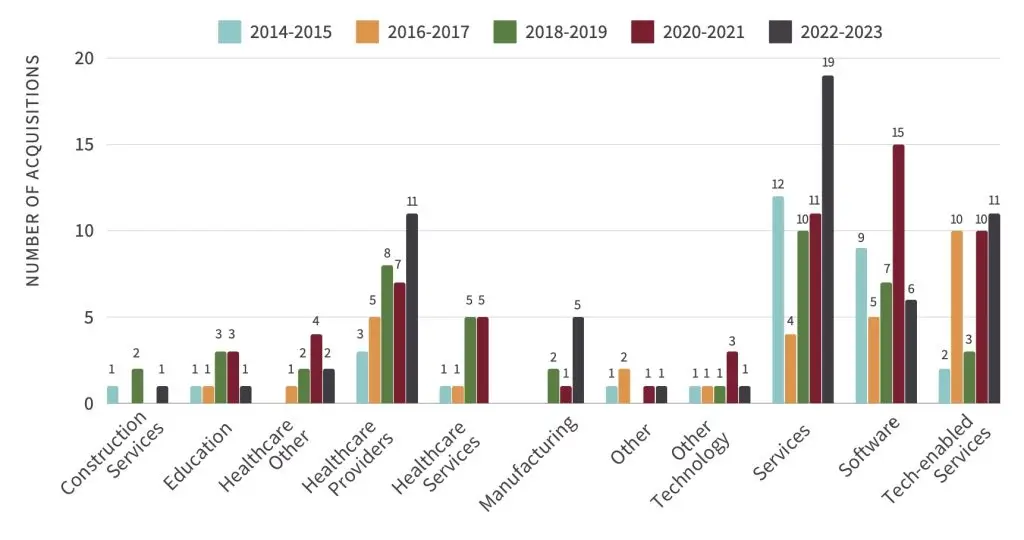
Image Source: Stanford Graduate School of Business 2024 Search Fund Study
Financial Performance and Returns
- Average IRR (all funds): 35.1%
- Average ROI multiple: 4.5×
- IRR for exited deals: 42.9%
- Share of positive ROI acquisitions: ~70%
- Most common ROI band: 2×–5×
The data from Stanford’s 2024 Search Fund Study found the returns from all search funds remaining in line with historical trends. The internal rate of return (IRR) of all search funds averaged 35.1%. The average return on investment (ROI) for all search funds was 4.5x as of the end of 2023.
The data shows 63% of search funds result in an acquisition. And nearly 7 in 10 acquired companies generated positive returns. The returns of search funds, measured in IRR, for companies that have exited increased to 42.9% due to several exits in the most recent dataset that achieved significant returns. But the average IRR when excluding the top handful of performers remains little changed.
Search Fund Outcomes
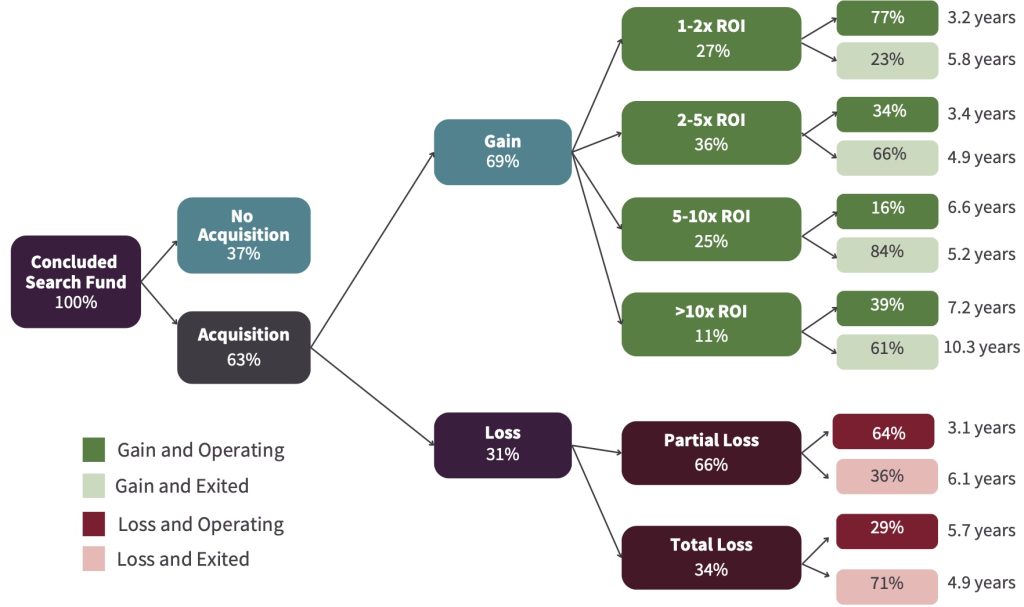
Image Source: Stanford Graduate School of Business 2024 Search Fund Study
Aggregate Search Fund IRR (2011–2024)

Image Source: Stanford Graduate School of Business 2024 Search Fund Study
Of all search fund-acquired companies, the ROI distribution shows that 69.5% generate positive returns, with the most common result falling in the 2x-5x return range.
- 10x ROI: 8%
- 5x–10x ROI: 17.5%
- 2x–5x ROI: 25%
- 1x–2x ROI: 18.5%
- Partial loss: 20.5%
- Total loss: 10.5%
ROI to Date of Search-Acquired Companies (n=296)
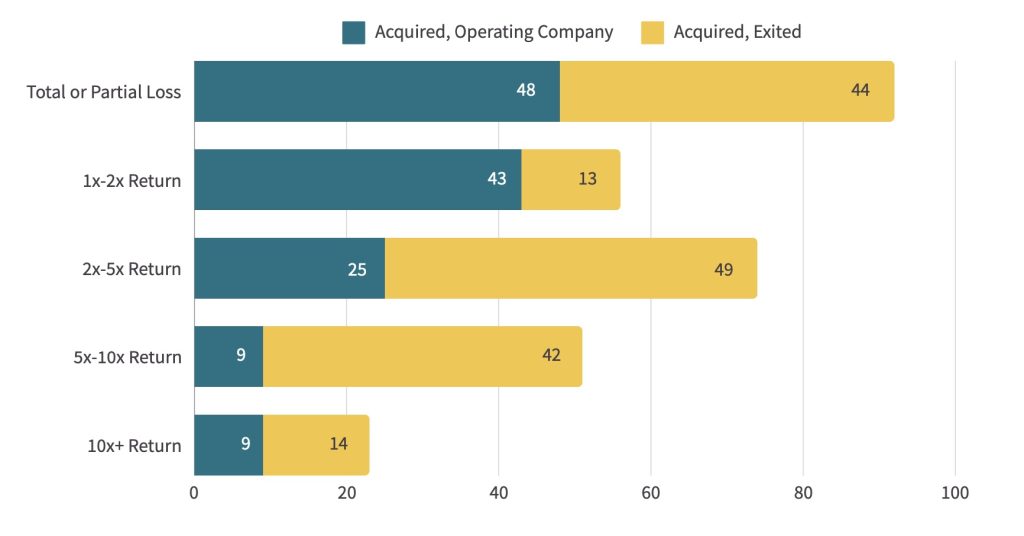
Image Source: Stanford Graduate School of Business 2024 Search Fund Study
Searcher Demographics
- Finance / Investment Banking backgrounds: 23%
- Consulting: 16%
- General Management: 14%
- Private Equity: 12%
- Military: 10%
- More women and non-MBA searchers than ever before
Broadly speaking, the demographics among search fund entrepreneurs continues to become more diverse as adoption of the acquisition entrepreneurship model expands.
The 2023-2023 data shows an uptick in ethnic diversity among first-time searchers, more female searchers than ever, and a record high number of searchers participating without an MBA degree.
First-time searchers now come from diverse professional backgrounds.
- Investment Banking/Finance: 23%
- Management Consulting: 16%
- General Management: 14%
- Private Equity: 12%
- Military: 10%
- Operations: 7%
- Entrepreneur: 7%
- All Others: 11%
This represents a change from past years, where private equity professionals dominated the search fund industry, representing more than a quarter of all new searchers.

Image Source: An Introduction to Entrepreneurship-Through-Acquisition and the Secrets to Its Success | Forbes.com (Mosaic ETA)
Ethnicity of First-Time Searchers (2022–2023)
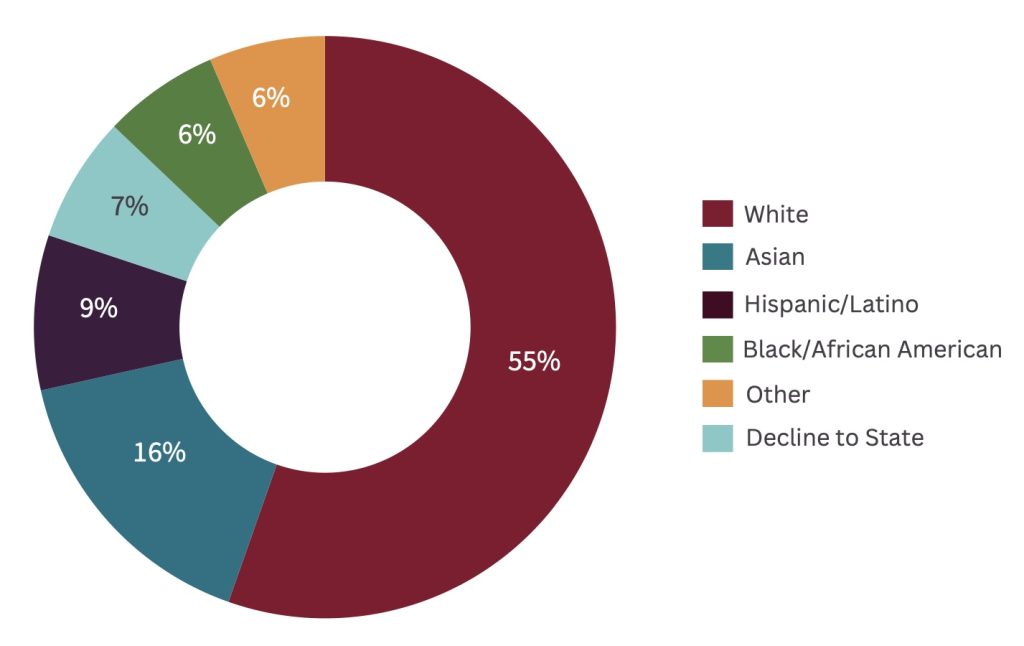
Image Source: Stanford Graduate School of Business 2024 Search Fund Study
Final Thoughts
The search fund statistics tell us the landscape continues to evolve and provide opportunities for the next generation of entrepreneurial-minded professionals.
Search funds continue to deliver strong financial returns for an increasingly diverse group of searchers and investors, and it is expected to continue into 2025 and 2026.
Beyond the traditional (core) search fund universe, we know self-funded searches, independent sponsors, and other alternative search models continue to grow in popularity as well, further demonstrating the viability and variety of entrepreneurship through acquisition opportunities.


